Boundary Detection#
Note
Boundary detection refers to distinguishing unique objects in an image (e.g. these pixels are a unique object). Object detection refers to identifying unique objects in an image (e.g. this image contains a squirrel). This article is about boundary detection.
There are plenty of tools available for performing image processing, but let’s say that we want to implement our own boudary detection algorithm. How would you go about that? Here is my completely naive attempt at trying to solve this problem.
Now, I’m not an image processing wizard, but my guess is that you would somehow need to compare pixel value(s) to their neighbour(s). A simple solution could look like this:
If pixel values are similar enough, then the pixels might belong to the same object.
If pixel values are not similar enough, then they belong to different objects.
This seems simple enough, but in order to really solve this problem we will need to specify a few more things:
How do we determine neighbors of pixels?
What is our method for comparing pixel values?
How do we determine if pixels are similar enough?
What constitutes an object?
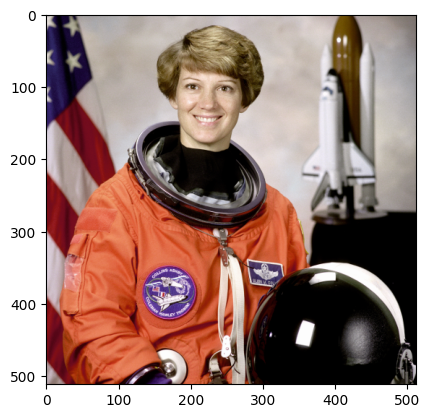
We’ll answer these questions one at a time and hopefully reach a satisfactory solution. First, let’s load our image using matplotlib facilities.
from pathlib import Path

import matplotlib.pyplot as plt
import networkx as nx
import numpy as np
import PIL.Image
img_path = Path("../res/astronaut.png")
img = np.array(PIL.Image.open(img_path)) / 256.0
plt.imshow(img)
plt.show()
Representing Connected Pixels#
We will use one of my favourite techniques: graph processing with networkx! Representing connected items is a problem that screams for a graph-processing solution.
We will represent our image as a networkx graph. Later on, if we determine that pixels are connencted, we simply create a connection between the two pixels.
def create_graph(img: np.ndarray) -> nx.Graph:
    nrows, ncols, _ = img.shape
    g = nx.Graph(nrows=nrows, ncols=ncols, img=img)
    for r in range(nrows):
        for c in range(ncols):
            g.add_node((r, c), color=img[r, c], group=None)

    return g


def draw_graph(g, node_size=1):
    pos = {n: (n[1], -n[0]) for n in g.nodes}
    node_color = [g.nodes[n]["group"] for n in g.nodes]
    cmap = "coolwarm"
    if any(nc is None for nc in node_color):
        node_color = [g.nodes[n]["color"] for n in g.nodes]
        cmap = None
    nx.draw_networkx(
        g,
        pos=pos,
        node_size=node_size,
        node_color=node_color,
        with_labels=False,
        cmap=cmap,
    )


g = create_graph(img)
draw_graph(g, node_size=5)

Finding Neighbouring Pixels#
We will use a simple approach of just itereating over the rows and columns of our images. Pixels are adjacent to eachother if they are:
in the same row and adjacent column
in the same column and adjacent row
def pixel_neighbor_iterator(g):
    nrows = g.graph["nrows"]
    ncols = g.graph["ncols"]
    for r in range(nrows):
        for c in range(ncols - 1):
            yield (r, c), (r, c + 1)
    for c in range(ncols):
        for r in range(nrows - 1):
            yield (r, c), (r + 1, c)
Comparing Pixel Values#
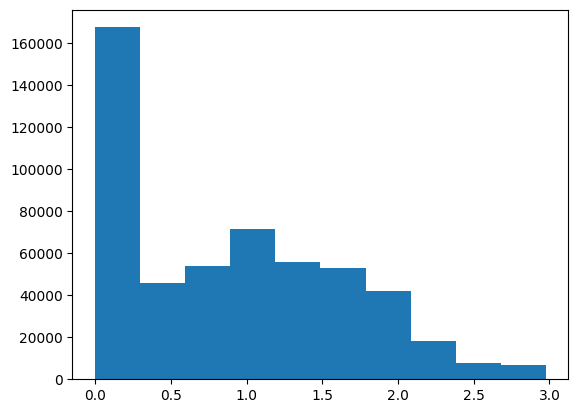
Imagine if we treat all the pixels in an image as vectors. Vectors have both magnitude and direction. The dot product is a mathematical operation that can be used to compare the magnitude and direction of two vectors. I’m not a mathematician so I won’t pretend to fully understand how it works… that’s why I’ve added a link for more details. Could we use this simple measurement as a means for comparing pixel values?
We have an image already, so let’s plot a histogram of all of our dot products so we get an idea of what we’re working with.
dots = []
for s, t in pixel_neighbor_iterator(g):
    dots.append(np.dot(g.nodes[s]["color"], g.nodes[t]["color"]))
plt.hist(dots)
plt.show()
Determining if Pixels are Connected#
The dot product of two vectors returns a single value (i.e. a float). Could our logic be as simple as computing the dot product of two pixels, and it is below some threshold, then we can assume the pixels belong to the same object?
def are_pixels_connected(p1, p2, dot_threshold: float) -> bool:
    dot = np.dot(p1, p2)

    if abs(dot) <= dot_threshold:
        return True

    return False
Determining Objects in Image#
We are representing an object as a collection of pixels, right? If multiple pixels are connected, that’s an object, right? We can add some logic to our algorithm so that objects must be made up of a minimum number of connected pixels.
Now, lets put it all together. We will be given an image, and we want to follow all of the steps outlined above to split up the image into objects.
def determine_objects_in_image(
    img: np.ndarray,
    object_size_threshold: int,
    dot_threshold: float,
) -> None:
    g = create_graph(img)

    for s, t in pixel_neighbor_iterator(g):
        ps = g.nodes[s]["color"]
        pt = g.nodes[t]["color"]
        if are_pixels_connected(ps, pt, dot_threshold):
            g.add_edge(s, t)

    gc = nx.connected_components(g)
    nodes_to_remove = []
    for i, nodes in enumerate(gc):
        if len(nodes) < object_size_threshold:
            nodes_to_remove.extend(nodes)
        else:
            for n in nodes:
                g.nodes[n]["group"] = i
    g.remove_nodes_from(nodes_to_remove)

    print(f"Object Size Threshold : {object_size_threshold}")
    print(f"Dot Product Threshold : {dot_threshold}")
    print(f"Num Objects Detected  : {nx.number_connected_components(g)}")
    draw_graph(g, node_size=5)
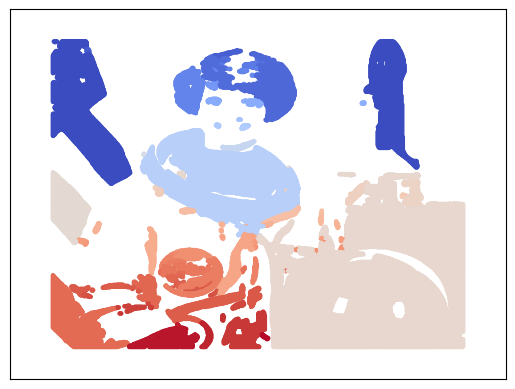
determine_objects_in_image(
    img,
    3,
    0.5,
)
Object Size Threshold : 3
Dot Product Threshold : 0.5
Num Objects Detected  : 152
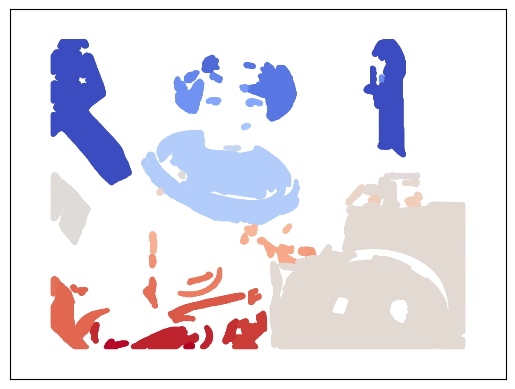
determine_objects_in_image(
    img,
    20,
    0.3,
)
Object Size Threshold : 20
Dot Product Threshold : 0.3
Num Objects Detected  : 49
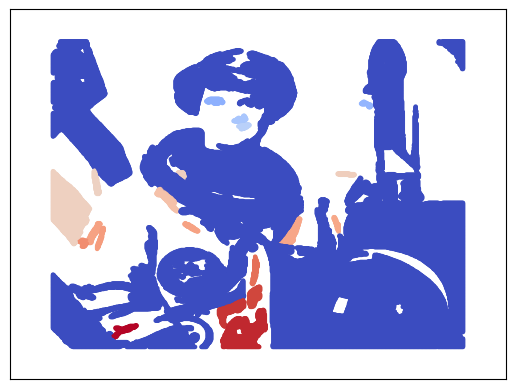
determine_objects_in_image(
    img,
    50,
    0.75,
)
Object Size Threshold : 50
Dot Product Threshold : 0.75
Num Objects Detected  : 23
Conclusion#
I’m actually quite impressed with this. It worked out much better than I expected!
There could be countless ways of doing this better. Namely, use an image proceesing library!